
SEO Ranking Factors for Travel & Tourism Websites
A few years ago, I/we became a little obsessed with stats and finding the travel ranking factors, for years I kept these a somewhat secret that we used to get some awesome wins for our clients.
Today we have gone ahead and released some of our favorite data points below that is sure to help you rank your travel site higher in search engines.
SEO Ranking Factors
The amount of content for travel sites
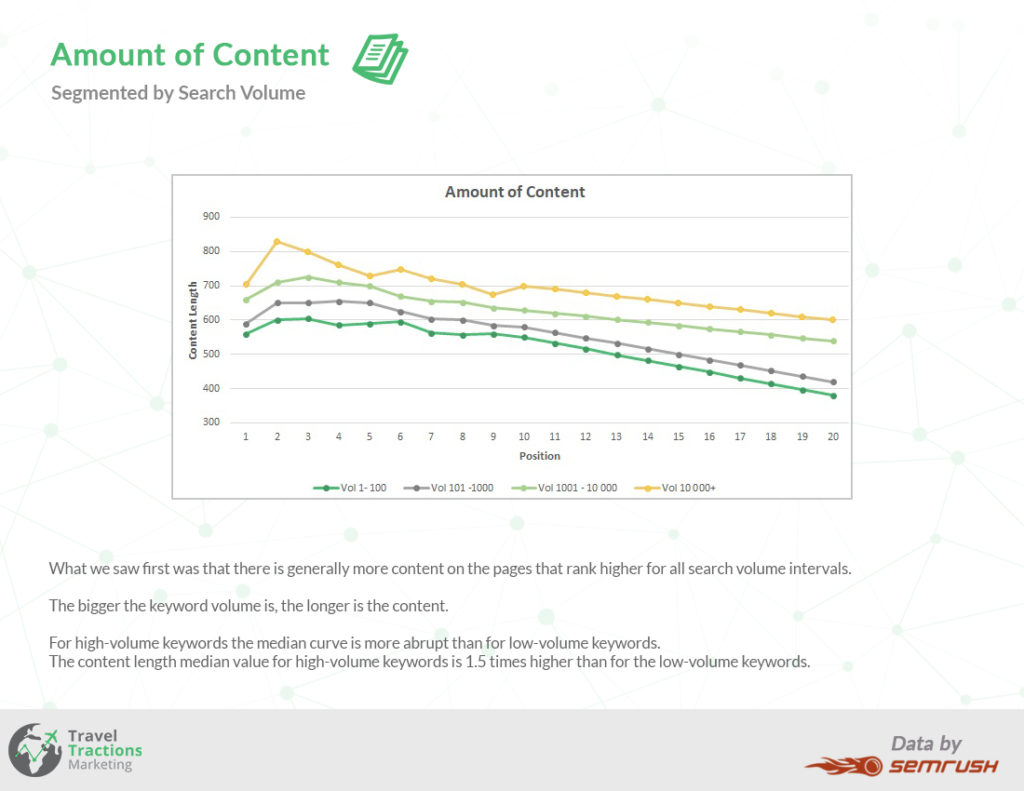
What’s interesting about this graph is that it is across all page on the internet, as time has gone on, long-form content has really been performing well for most but there seems to be a shift in Google now, where the intent is now the most important feature.
There is a strong correlation to the search volume and the amount of content needed, we see this too with difficulty but it’s not represented in this graph but very evident in our experience.
For our travel content writing services, we always check what is ranking currently and assess the words and make sure that we get the intent correct.
Keywords in your title
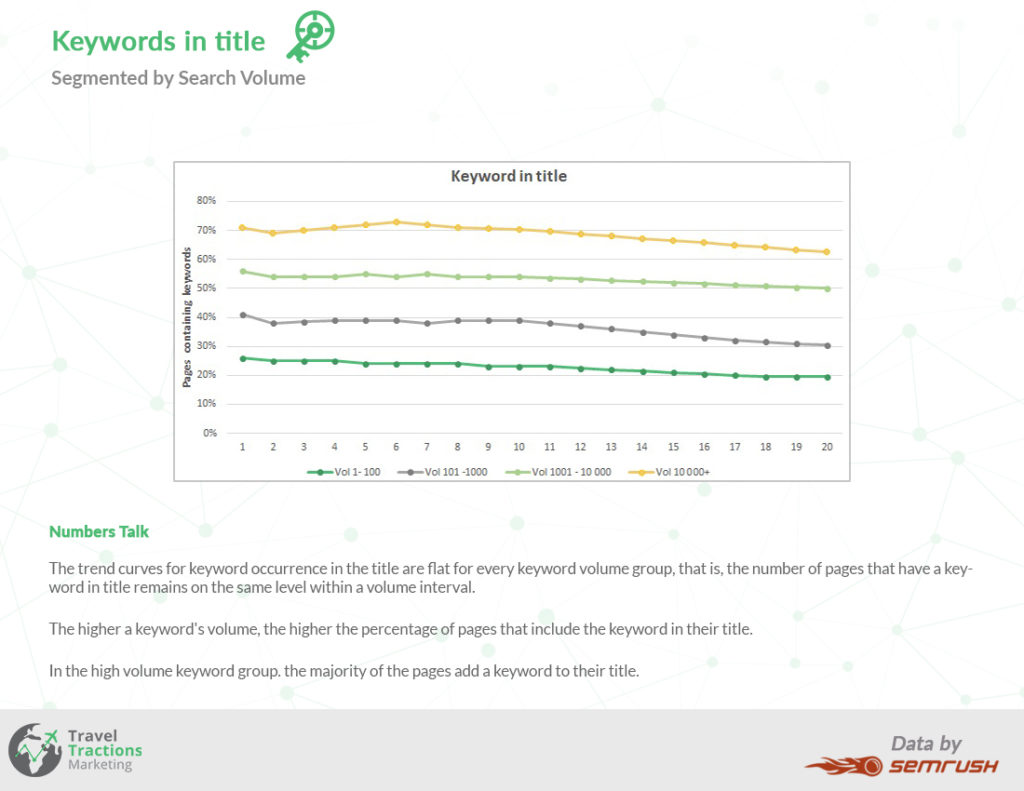
In today’s age, you should really have your keywords in your title. Again, a very strong correlation that the higher volume of the keyword, the great chance it’s in your title.
Number of images per page
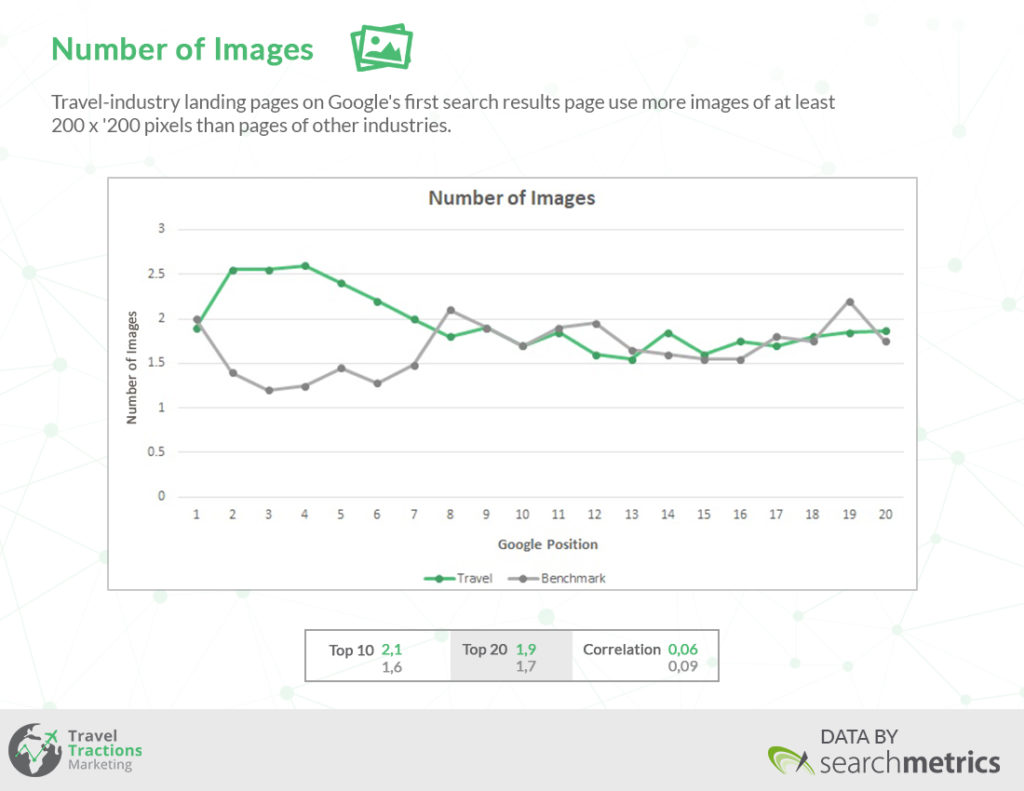
This is where travel really has a big difference in other industries’ benchmark. In the top posts, you can expect to have 2.1 images per post but if you take the data of Semrush above of the average size of the post, it would mean that there are ~2.1 images per 600 words, meaning an average of about 1 image per 300 words.
An insight that we take quite seriously at travel tractions and aim to have 1 image per 300 words.
Number of internal links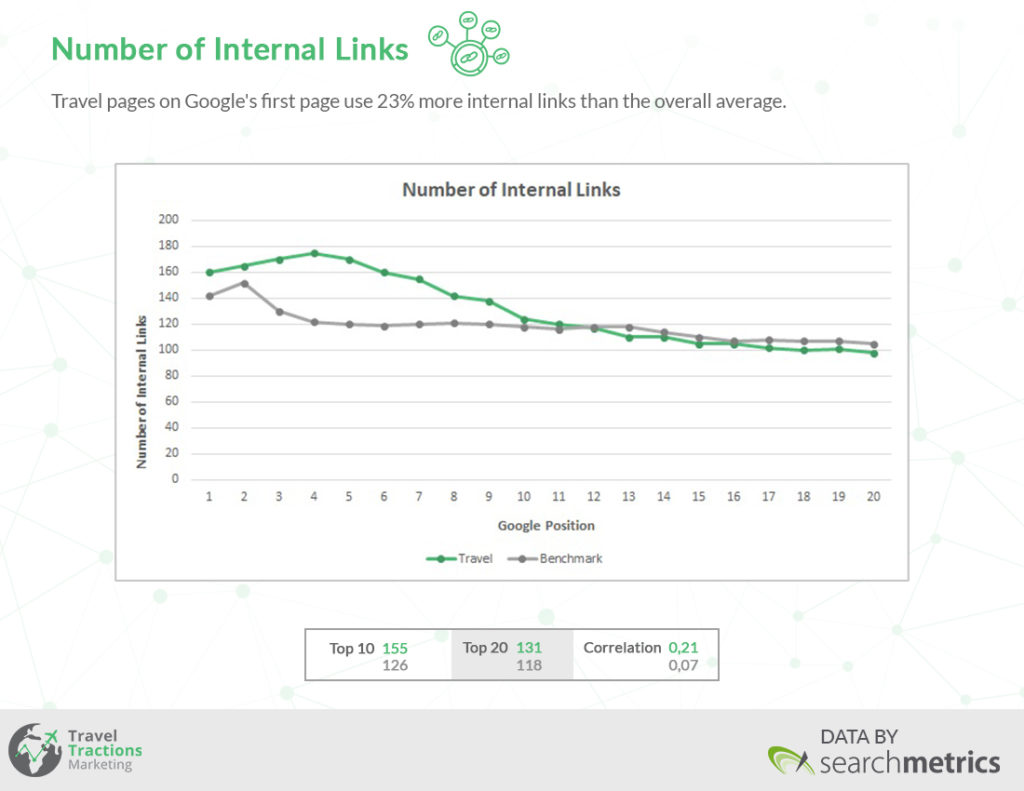
A very interesting insight here is that travel sites have 23% more internal links to their pages. I’m not 100% why of this, but travel sites generally have quite a lot of bloat and it’s great to link out to make sure that search engines can effectively crawl your whole site. This just shows that internal linking is an integral part of the success and should be done fairly often.
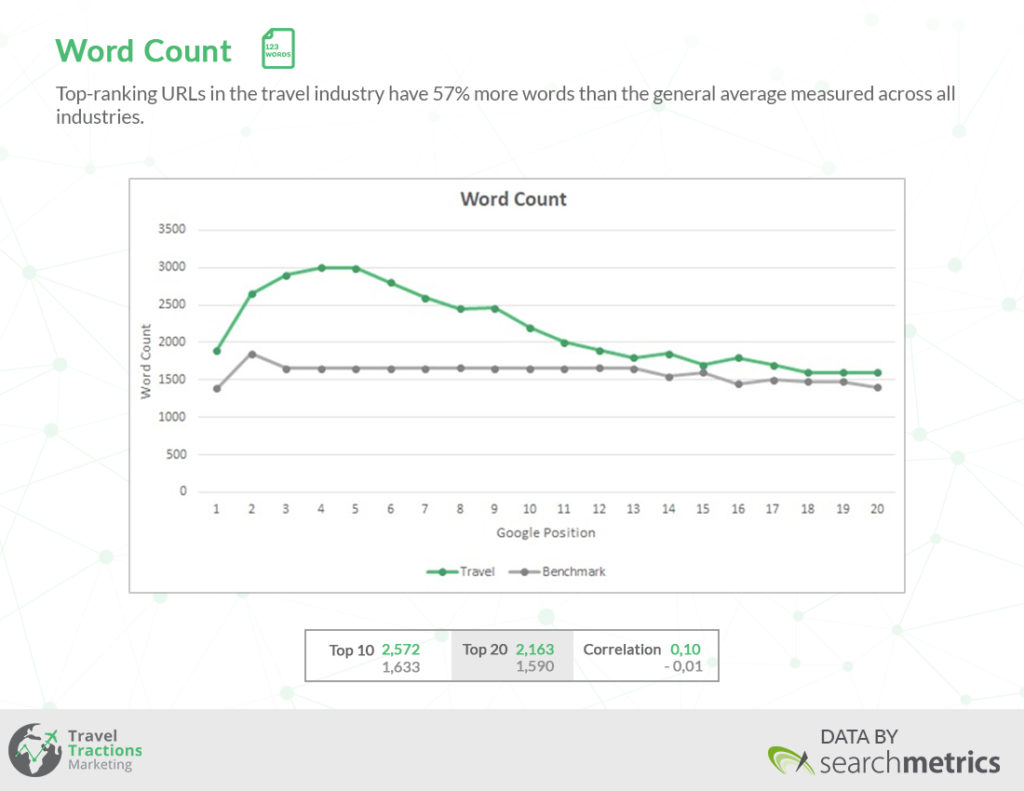
Amount of words on a page
Now, this is slightly different, the data set is from Search Metrics and compares the number of words per post is astonishing 57% more than others. Travel websites generally need more images AND content to be on par with what’s working right now with the average post being 2000 – 3000 words.
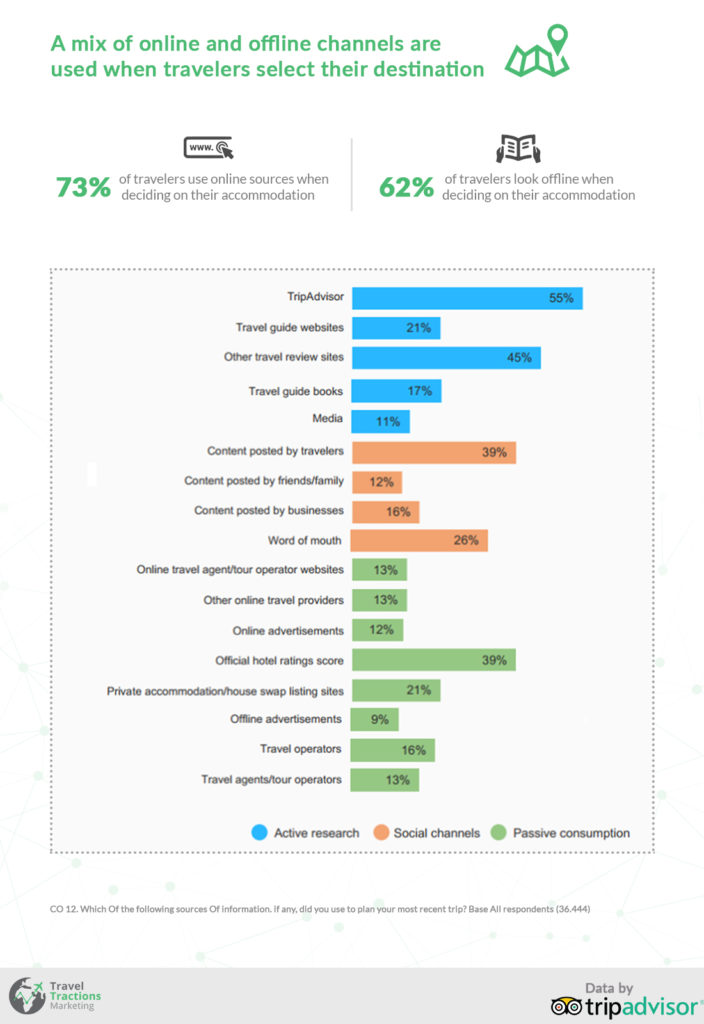
Travel Industry insights
Now, the above study was published in 2016. What’s so fascinating about it is that four years ago there was already such high usage of online portals when booking accommodation. I think we have changed to use online sources even more than this study shows, and the Lonely Planet books and travel agents’ phones are slightly dusty in 2020. I daresay that Tripadvisor has also taken a massive hit since this was published. An obvious insight, but an interesting one nonetheless.
Using the insights above we have been able to double, quadruple, and completely change travel businesses to generate their revenue from prominent online sources as SEO.
As the customer has the ability to search and find information for their ideal holiday. Being in this decision-making process as information to help them decide will help you get the reader into your marketing funnel and turn them into a client.

